
First things first: Spurious Dependence
Depending on your background, you have already heard of spurious dependence in a way or another. It goes by the names of spurious association, spurious dependence, the famous quote “correlation does not imply causation” and also other versions based on the same idea that you can not say that X necessarily causes Y (or vice versa) solely because X and Y are associated, that is, because they tend to occur together. Even if one of the events always happens before the other, let’s say X preceding Y, still, you can not say that X causes Y. There is a statistical test very famous in economics known as Granger causality.
The Granger causality test is a statistical hypothesis test for determining whether one time series is useful in forecasting another, first proposed in 1969.[1] Ordinarily, regressions reflect “mere” correlations, but Clive Granger argued that causality in economics could be tested for by measuring the ability to predict the future values of a time series using prior values of another time series. Since the question of “true causality” is deeply philosophical, and because of the post hoc ergo propter hoc fallacy of assuming that one thing preceding another can be used as a proof of causation, econometricians assert that the Granger test finds only “predictive causality”.
Granger Causality at Wikipedia.
The post hoc ergo propter hoc fallacy is also known as “after this, therefore because of this”. It’s pretty clear today that Granger causality is not an adequate tool to infer causal relationships and this is one of the reasons that when X and Y are tested by the granger causality test, and an association is found, it’s said that X Granger-causes Y instead of saying that X causes Y. Maybe it’s not clear to you why the association between two variables and the notion that one always precedes the other is not enough to say that one is causing the other. One explanation for a hypothetical situation, for example, would be a third lurking variable C, also known as a confounder, that causes both events, a phenomenon known as confounding. By ignoring the existence of C (which in some contexts happens by design and is a strong assumption called unconfoundedness), you fail to realize that the events X and Y are actually independent when taking into consideration this third variable C, the confounder. Since you ignored it, they seem dependent, associated. A very famous and straight forward example is the positive correlation between (a) ice cream sales and death by drowning or (b) ice cream sales and homicide rate.

One can clearly see that it’s possible to reasonably fit a line with a>0 in the plot above, which implies a positive [linear] correlation between the number of ice creams sold and the murder rate.

Though it can sound counter-intuitive in these cases, in some other cases it can sound solid. Apart from confounding bias, there are many other biases, such as collider bias.
A clear example of collider bias was provided by Sackett in his 1979 paper. He analysed data from 257 hospitalized individuals and detected an association between locomotor disease and respiratory disease (odds ratio 4.06). The association seemed plausible at the time – locomotor disease could lead to inactivity, which could cause respiratory disease. But Sackett repeated the analysis in a sample of 2783 individuals from the general population and found no association (odds ratio 1.06). The original analysis of hospitalized individuals was biased because both diseases caused individuals to be hospitalized. By looking only within the stratum of hospitalized individuals, Sackett had observed a distorted association. In contrast, in the general population (including a mix of hospitalized and non-hospitalized individuals) locomotor disease and respiratory disease are not associated. In 1979, Sackett termed this phenomenon “admission rate bias”.
Collider bias at Catalog of Bias.
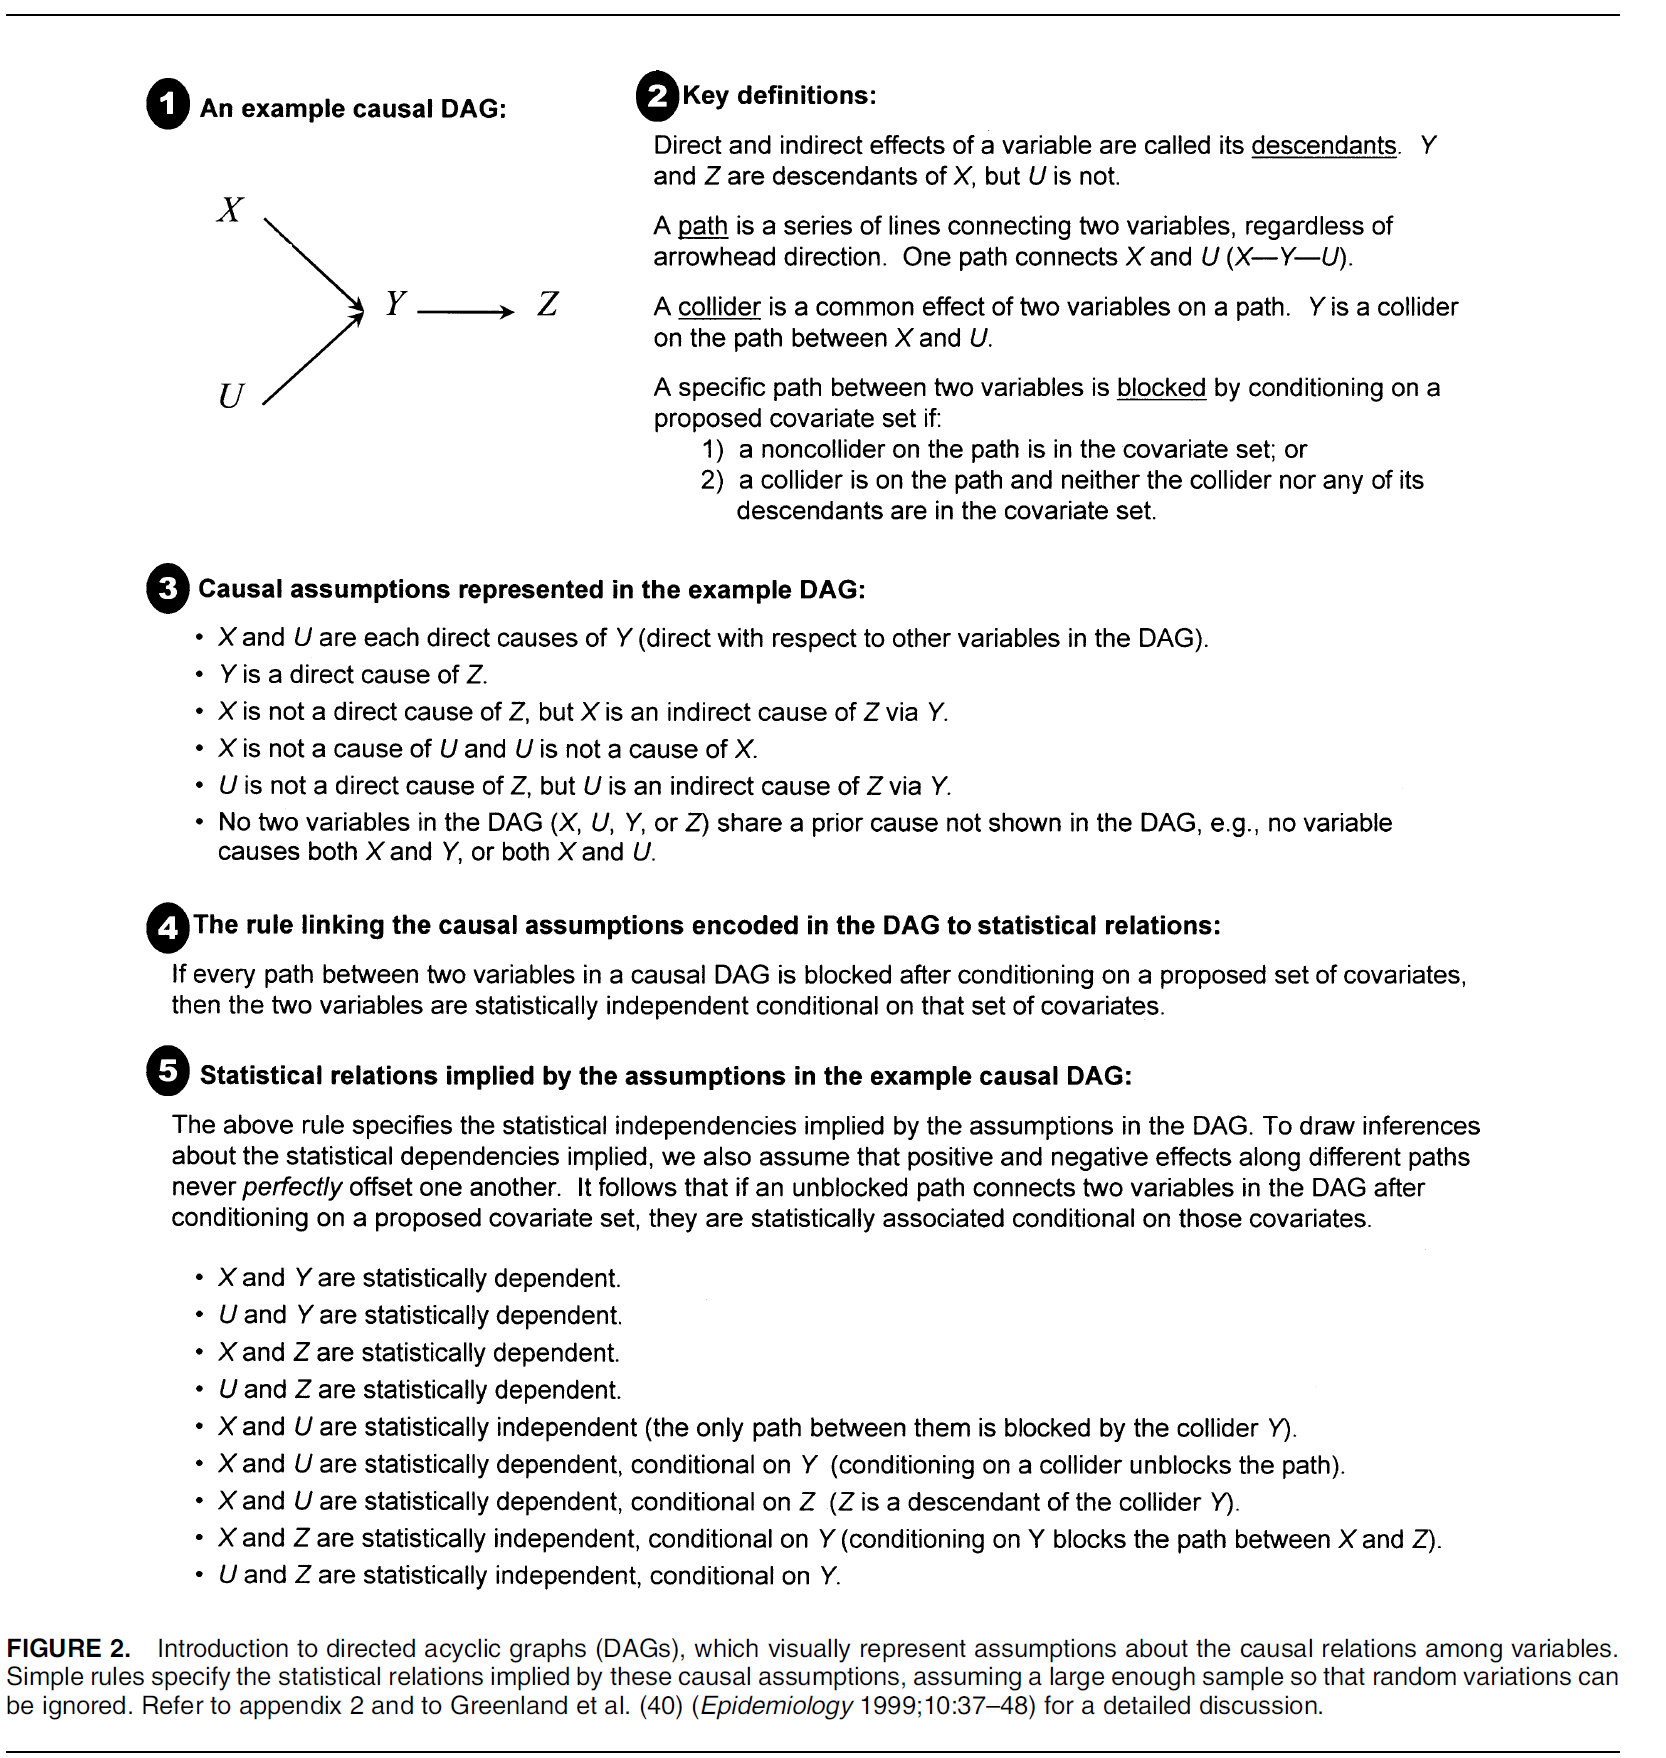
Causal graphs are usually shown through Directed Acyclic Graphs (DAGs) where nodes or vertices represent random variables, edges represent causal association between variables and the orientation of edges (direction of arrowhead) identifies which variable causes which (A \rightarrow B or B \rightarrow A).
The DAG for the Sackett initial analysis on hospitalized patients can be seen below.

One must never condition on a collider. If it is not clear to you what I mean by conditioning or controlling, think of C in P(A,B|C). The collision of arrows means no flow of information through this path. However, if you control for it you open the path and therefore you add bias to your estimation of the effect from the exposure variable on the outcome variable. Since both variables cause hospitalization, knowing that someone has one of them and is hospitalized helps you guess if the patient also has a respiratory disease. When you go to the general population though, as Sackett realized, knowing that someone has locomotor disease tells you nothing about the same person also having a respiratory disease. I won’t go into much detail on causality and causal graphs here, but The Book of Why is an excellent introductory book for causality and causal graphs in a very light language. If you want something shorter, there is this very good article on causal inference. This association effect when conditioning on a collider is known as explaining away effect. Let’s go to one last example. Let’s say there are only two ways your car stops moving (S) against your will: either the engine stopped working (E) or you ran out of fuel (F). E \rightarrow S \leftarrow F. Since they’re independent, you can not guess E based on F. A car stopped in the street can be with both the engine broken and without fuel, for example. A car moving can be with the engine working and with fuel. But if you condition on S (car stopped working against your will) and you verified that there is fuel (F), you explain away this cause and therefore it must be the engine that stopped working (E). You can read about it here and more here.
Regarding the two analyses on ice cream sales, there is a third variable that happens to be a confounder: Temperature. In the summer, when it’s warmer, people tend to swim more often, go out more often and buy ice cream more often. The DAG for this can be seen below.

Ice cream sales (I) and Homicide rate (H) are actually independent and you can verify this by conditioning on temperature (T), that is, P(I, H|T) = P(I|T)P(H|T). The idea is to adjust for temperature so that you remove the effect temperature has in the effect by ice cream sales to the homicide rate. The same can be seen for death by drowning. You must remove confounding in order to properly estimate the effect by the exposure variable (ice cream) on the outcome variable (homicide rate).
You can see many more examples of spurious correlation here. This is not what brought me here today to write this post, though :-). Now that you’re introduced to spurious dependence, or understood what I mean by spurious association (or lack thereof), we can finally move to spurious independence :).
Ok, time for a bit of coding.
library(tidyverse)
set.seed(42)
N = 10000
# X and Y cause CD, that is, CD is a collider variable
# in relation to X and Y
# X -> CD <- Y
X = rnorm(N)
Y = rnorm(N)
CD = 1/2 * X + 1/2 * Y + rnorm(N)
df = data.frame(
    X=X,
    Y=Y,
    CD=CD
)
cor.test(df$X, df$Y)$estimate
The output of the correlation test above is -0.007281603. This is very close to zero, which means these variables can be said to be linearly independent (let’s ignore how significant our results are, for example, for the sake of this example). What if we condition on the collider and then assess the correlation between X and Y?
collider_df = df %>% filter(CD > 1)
cor.test(collider_df$X, collider_df$Y)$estimate
The output of the correlation test above is -0.1688186. A Pearson correlation is a number between -1 and 1 that indicates the extent to which two variables are linearly related. The farther from zero, the more associated they are. As you can see from the results above, X and Y look more associated after conditioning on the collider CD. What about confounding?
library(tidyverse)
set.seed(42)
N = 10000
# X and Y are caused by CF, that is, CF is a confounder variable
# in relation to X and Y
# X <- CF -> Y
CF = rnorm(N)
X = 0.6 * CF + rnorm(N)
Y = 0.4 * CF + rnorm(N)
df = data.frame(
    X=X,
    Y=Y,
    CF=CF
)
cor.test(df$X, df$Y)$estimate
The output of the correlation test above is 0.196769. What if we condition on the confounder and then assess the correlation between X and Y?
confounder_df = df %>% filter(CF > 1)
cor.test(confounder_df$X, confounder_df$Y)$estimate
The output of the correlation test above is 0.07287249, which is inferior to the value previously calculated. That is, our initial correlation test was biased because of the confounder.
Takeaways for spurious dependence:
- Do not control for colliders. You will bias your causal inference between the two variables colliding at the collider.
- Control for confounders, otherwise you will obtain a biased estimate of the two variables being caused by the confounder.
- In dense graphs (big number of nodes and edges), things can get a bit more complicated, though solutions, when found, can be pretty simple. If you’re interested in this, check this link on d-separation set.
Spurious Independence

In this post, I’m interested in sharing with you some thoughts on a different spurious relationship: independence. If it’s the first time you’re running into this, there is a reasonable chance you’re feeling the same way I felt at first sight: “How can you have spurious independence!?”. It’s reasonable to have the impression that A is causing B, mostly if A always precedes B, and then understand what’s going on when you’re made aware of another thing that is the cause of both of them. Or to restrict your samples to a subset that may look like they’re associated (Sackett’s example). But, come on, how can two things that look independent be associated in reality? It can be a bit trickier to understand this one and that’s why I gave a lengthy introduction to spurious dependence before. Let’s have a quick look at graphs so that I can give you a graphical explanation for that.
If you think in terms of a DAG with unshielded triplets, that is, three nodes with only two edges, there are four possibilities (three if you ignore orientation for chains) you can draw:

Chains ( X \rightarrow Y \rightarrow Z or X \leftarrow Y \leftarrow Z), forks and colliders (also called v-structures). Colliders are particularly pretty interesting, you can play with them here.
The concept of “controlling for” or “conditioning on” a node can also be seen as data slicing. Thinking of it this way can also help you understand the bias found by Sackett. Let’s say we’re analyzing the wage gap. We could have a binary variable position (p) with two possible values: management position or non-management position. We want to control for that, that is, to make this variable constant, so we can check the direct effect of something (such as gender, g) on the wage (w). By making p=management, for example, you’re slicing the data (you are removing the wages of non-management positions from your data). Let’s abstract a little. What about immigrants in management positions? And young immigrants in management positions? What about young latin-americans that like rock and roll in management positions? As you can see, the more variables (parameters) we condition on, the less data we have compared to not conditioning at all (full dataset). Save this reasoning, it will be useful soon.
By conditioning on nodes in a DAG you can either close or open a path through which information can flow. In chains and forks, the path is open so you can close the path by controlling for a variable in this path. For example, if X causes Y and Y causes Z, and X does not cause Z unless through Y (which means X \rightarrow Y \rightarrow Z) , you can make X independent from Z by conditioning on Y (check the chain unshielded triplet figure already shown in this post). In colliders, the path is closed by default but you can open the path by conditioning on the collider. If X and Z cause Y but X is marginally independent from Z, there is no dependence between X and Z (X \rightarrow Y \leftarrow Z). However, if you condition on Y, you create a spurious dependence between X and Z. If you do not control for a confounder in forks, you are creating spurious dependence. If you control for a collider in a v-structure, you are creating spurious dependence. As you can see, when thinking of an unshielded triplet of nodes, even though it is clear how to obtain spurious dependence, it is not clear how you would create spurious independence either by controlling or not controlling. However, it is possible to have spurious independence and here I will talk about 4 situations related to spurious independence.
In the network discovery/inference field, you have basically two main approaches: constraint-based methods (e.g. PC algorithm) and score-based methods (e.g. Bayesian networks). In the constraint-based methods, the algorithm starts with a fully connected graph, also known as a complete graph, and by measuring the lack of statistical association between the nodes, that is, by testing positive for independence, the algorithm removes the edge. If X and Y, initially connected, are shown to be [marginally] independent, there is no reason to have an edge between them, for an edge indicates that there is a direct association between them. Apart from marginal independence, these methods also consider conditional independence, that is, they try to measure the independence of X and Y given a third variable Z or even a set of variables s = Z_1, Z_2, ..., Z_N, known as a separation set. It’s called like this because the set separates X from Y.
(1) Too many variables, too few samples
One of the problems you can run into with these methods is that if you have a number of nodes N given that N is very large, and your sample size is small, there is a chance that by conditioning on a big number of these nodes (repeatedly slicing your data) you will somehow make X and Y look independent even if in reality they are not. This is a limitation of traditional constraint-based methods. A dataset with a small sample size with a huge number of variables can work as a poison for these methods.
In Isambert team at Institut Curie, we (and many other researchers through the years) have developed a mixed method for causal network discovery called MIIC (Sella et al (2018), Verny et al (2017), Affeldt et al (2016) and Affeldt and Isambert (2015)). It searches for independence between variables, such as constraint-based methods, at the same time that it makes use of scores, just like the score-based methods. Instead of blindly adding variables to the separation set to check if it’s possible that X and Y are independent given these other covariates, we expanded the formulation of mutual information to a multivariate mutual information where we add nodes one by one to the separation set and check, one by one, if they contribute to the independence between X and Y. If they do not, we do not keep them in the set. We call these nodes contributors and the idea is pretty straightforward: If MI(X,Y|Z_1) < MI(X,Y), this means that Z_1 is contributing to explain X from Y and vice-versa. Z_1 could be a common cause, a confounder, for example. Therefore, we keep Z_1 in the separation set for X and Y. If MI(X,Y|\{Z_1,Z_2\} >= MI(X,Y|Z_1), Z_2 is not contributing and therefore we do not keep Z_2 in the separation set. Then we go to Z_3, given that there is a Z_3. MI means Mutual Information and it is the measure we chose to test for association between random variables. Differently from Pearson correlation that only works fine for variables that are linearly associated, MI has good performance over different data relationships.

As you probably know, if MI(X,Y) = 0, then X and Y are independent, that is, X \! \perp \! Y. MIIC makes use of multivariate mutual information and a complexity term (Normalized Maximum Likelihood, NML) taking into consideration sample size, for example, to decide if nodes are independent.
The idea to write this post actually came up when I saw a poster addressing this case by Bellot and van der Schaar (2019) at NeurIPS 2019.
(2) Spurious conditional independence due to sampling
When we have a sample of a population we assume that this sample is representative and has the same characteristics as the real distribution. We usually assume that the conditional dependencies or independences that we see in our sampled data are the same as in the population. However, this is not always the case. The existence of such cases is a big problem in constraint-based methods for the order of evaluation can change the final network. That’s why PC original algorithm is called order-dependent. PC has an Oracle and a Sample version, where the sample version is the realistic one in which we do not know the conditional dependencies at beforehand and therefore we must estimate them. This version is the order-dependent one. If the algorithm evaluates first the nodes with the spurious conditional independence (sample noise), we may remove edges that will puzzle our calculations when evaluating nodes with conditional dependencies that are found in the same way in the real population. If by chance we leave them for last, we do not have this cascade effect.
Let’s say you have a set of cards with what directions (right, left, backward, upward) to take to get to the exit of a labyrinth, and they’re given to you in the right order. However, one of them is wrong. If the wrong card is the last one, this is fine. You’re very close to the exit and you will probably be able to leave. The exit can even be just in front of you at the end. However, if it’s the first card, there is a chance that all the other cards, that have correct coordinates, will lead you to the wrong path and therefore leave you lost in the labyrinth.
A modified version of PC (PC-Stable) by Colombo and Maathuis (2014) improves PC by making it order-independent and therefore safer regarding this issue.
(3) Contributor node is not in the path
There is also another type of cause for spurious independence. One that can be clearly seen through graphical models. Consider the graph X \rightarrow Y \rightarrow Z. There are only these two edges in this graph. We can lower MI(Y,Z) by conditioning on X, that is, MI(Y,Z|X) < MI(Y,Z). However, X is a father of Y (there is an oriented edge from X to Y), and this is the only path between X and Z. This means that having X in the separation set, together with other variables, could make Y independent of Z even if X is independent of Z conditioning on Y . That is, there is no path between X and Z not passing through Y and still X can make Y independent of Z. A node must be in a path between Y and Z in order to be considered to be in the separation set for the statistical association between Y and Z. The original implementation of PC and other algorithms based on PC do not take this into consideration, which can lead to spurious independence.
MIIC is not vulnerable to this for it searches for consistent separation sets. Li et al (2019) wrote a fix for the PC-Stable (and derived) algorithms to also look for consistent separation sets.
(4) Contributor is in a collided path
After obtaining the final causal graph, it can happen that a node that is in the non-oriented path between two other variables can not be in the separation set because there is a collider in this path. Since information does not flow through colliders, this node can not affect the outcome variable and therefore can not be in the separation set. This could have happened during the skeleton phase, in a step that the graph is still not oriented and therefore the algorithm can not know if nodes are colliders or not.
The previous fix by Li et al (2019) also makes MIIC safe regarding this possibility.
Independence or death!

You probably heard about data torture to get what you want and most people are aware of p-hacking and other bad conducts. However, this post goes beyond that to situations in which researchers are not aware of the possibility of some biases affecting their estimates. It can be mindblowing to some people that correlation does not imply causation, or when made aware of confounding effect. Just the same, but less obvious maybe, there is also spurious independence. Now you know 🙂